 Help
Help
GetCharting Help
Charting
Charting Options
Definitions of Filters
Firewall Settings
Internet Explorer
JavaScript
Yahoo Downloading
 Charting
Back to top
Using Internet Explorer Find to locate a Symbol
To use the Internet Explorer Find to locate a Symbol from a list of charting symbols, from the Internet Explorer menu select:
- Edit
- Find (on This Page)... Ctrl+F
- Tick the check box "Match whole word only"
- Enter the symbol to find
- Press "Find Next"
- If the cursor is not at the required symbol press "Find Next" again
Volume
Why does the volume show a number like 31,342.7 ? This value may be the actual value divided by 100, i.e. the volume traded is 3,234,270
Charting Options
Back to top
TimeScale
The time scale is the scale used on the time axis of the chart, this can be set by choosing from the TimeScale drop down one of:
- Daily
- Weekly
- Monthly
- Quarterly
The Weekly, Monthly and Quarterly time scale display each price as at the end of the Week, Month or Quarterly respectively. With Weekly, Monthly and Quarterly, for the most recent price if it is not the end of week, month or quarter the last price will be displayed.
MAIN CHART
The price chart displays the values for the time scale selected. The type of price chart displayed can be selected by choosing from the Price drop down one of:
- Line
- OCHL
- Candlestick
A Line chart will display a line graph of the Close price values.
An OCHL chart will display for each period the Open, Close, High and Low price values.
A Candlestick price chart displays the Open and Close values as a box with the box left clear if the Close price is greater than the Open price, or if the Close price is less than the Open price then the box is colored black.
A simple moving average technical analysis indicator can be added to the main chart by selecting one of the single or multiple simple moving average options from the Average drop down. For each price period the simple moving average is calculated as the average (sum of the periods / number of periods) for closing price values.
SUB CHART
The chart below the main price chart to display one of the following technical analysis indicators:
- Volume
- ADX
- MACD
- MACD Histogram
- On Balance Volume
- RSI
- Stochastic
Each of the values for indicators is calculated corresponding to the time scale selected.
Volume is the total volume over the time period.
ADX is the Average Directional Movement Index indicator calculated using 14 time periods.
MACD is the Moving Average Convergence Divergence indicator calculated using 12 and 26 time periods.
MACD Histogram indicator is calculated from the 12 and 26 period MACD.
On Balance Volume indicator is a cumulative calculation based on volume and price close.
RSI is the Relative Strength Index indicator as created by J Welles Wilder Jr., is calculated using 14 time periods.
Stochastic indicator as created by George Lane, is calculated using 5 and 3 time periods.
Show Charting Tools with trading dates
To show the annotation charting tools, check the tick box Show Charting Tools with trading dates and press View New Selections
The charting tools provide annotation facility for the Main Chart and Sub Chart with a trend line and commentary text. To make it easy to draw the trend lines and add text for a date the options for the dates are in drop down lists. To display the trend line or text, change the Hidden drop down to Show at High or Show at Low. To stop having the line or text displayed put the drop down back to Hidden. The date of the first drop down is the from date, the second date drop down is the to date.
Trend line: display location, available dates from to is used to add to the chart a trend line between two dates, above or below the Main Chart price or the Sub Chart indicator value
Commentary text: display location, available dates is used to add to the chart a comment at a date, above or below the Main Chart price or the Sub Chart indicator value. Enter the text you want displayed into the input box, text longer than the width of the box can be entered, just keep typing until no more characters can be entered. The text will be displayed above or below starting at the display location date selected in the date drop down list.
Filter Definitions
Back to top
TimeScale: the scale used for the period, this can be set by choosing from the Time Scale drop down one of:
- Daily
- Weekly
- Monthly
- Quarterly
Close is a new: selecting High or Low filters to extract the symbols for which the closing price hit the new high or new low at the end of the period selected. Selecting High break out or Low break out filters to extract symbols that, in the second last period were not making a new high or low, and in the last period are making a new high or low.
Period: determines how many Days, Weeks, Months or Quarters (as chosen by the TimeScale) that the screening will look back to determine if a new High, High break out, Low or Low break out has occurred.
Close is: filters symbols on whether closing price is a minimum or maximum value
Volume is: filters the symbols on whether the volume is a minimum or maximum value
Volume for each value is the total volume over the time period for Weekly, Monthly and Quarterly time scale or the Daily volume for a Daily time scale.
Last traded in: if this month or last month is selected then only the symbols whose last traded date is within the this month or the previous month will be included, symbols older than two months will be excluded.
Firewall Settings
Back to top
Firewall pops up request message box
To make the program easy to use, GetCharting runs as an application that is accessed through the browser, thus your firewall may think there is a connection to the internet when the GetCharting application first starts up.
When you first run GetCharting if your firewall pops up a message box requesting input, leave the connection to the program C:\GetCharting\j...\bin\javaw.exe unblocked and permit access to the internet. If there is a check box 'Always use this action' then tick it otherwise the firewall will keep requesting permission each time GetCharting is started
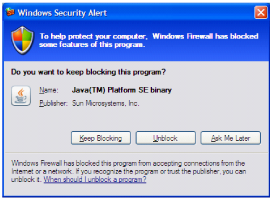
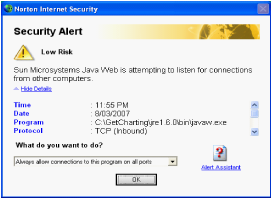
Due to some firewalls not distinguishing between the browser accessing a program on your computer or accessing the internet, a message to the effect 'Send information to the internet...' may be displayed.
Port
The port number GetCharting uses is 28583. This is automatically read by GetCharting from the configuration file so no user action is required. The port number is defined in the program configuration file getcharting_install.properties.
Internet Explorer
Back to top
Messages
-
"The page cannot be displayed" is shown in the browser whilst using GetCharting. First check the GetCharting server is running. This is a window titled "GetCharting-Mi Server". If it is not then start the server again either by double clicking on the desktop icon or through the Windows Start menu. If the server is running and "The page cannot be displayed" message is shown in the browser then the temporary files created by Internet Explorer need to be deleted. To do this, from the Internet Explorer menu select:
- Tools and then click on Internet Options...
- A smaller window titled Internet Options will appear
- Click the Delete Files... button.
- A smaller window titled Delete Files will appear
- Click on the OK button in the Delete Files window. This will delete the temporary files created by Internet Explorer.
- Click on the OK button in the Internet Options window
Changing the default start-up browser
When the GetCharting software is installed, your current default browser will be launched when GetCharting is started.
If you change your default browser you can simply re-install the GetCharting software, this will pick up the new default browser.
Not recommended, but you can manually change the default browser by editing the program configuration file getcharting_install.properties and set the entry for getcharting.browser property as for internet explorer:
- getcharting.browser=C:\Program Files\Internet Explorer\iexplore
JavaScript
Back to top
JavaScript enabled browser
To make the program easier to use GetCharting uses JavaScript. This requires that JavaScript be enabled. From the Internet Explorer menu select:
- Tools and then click on Internet Options...
- A smaller window titled Internet Options will appear
- Click the Security tab.
- Click on the Custom Level... button.
- A smaller window titled Security Settings will appear.
- Scroll down to the Scripting section.
- For Active Scripting select Enable.
- Click the OK button to make the change.
- A message box will appear asking Are you sure..., click the Yes button.
- Click OK to close the Internet Options window.
- Stop the GetCharting program and close all other Internet Explorer browser windows and then start GetCharting again.
Yahoo Downloading
Back to top
Download Messages
In general if there is a message indicating a problem with the download of data for a symbol check your internet connection and try again using Retry Update button.
Following lists some messages that may be displayed and what to do:
- "Connection refused: connect" This message may result from being unable to connect to the internet, try again in a short while using Retry Update or downloading again later.
- "Connection reset" This message may be the result of a busy server, try again in a short while using Retry Update or downloading again later.
- "Connection timed out: connect", "connection timed out" Try again using the Retry Update button.
- "Error saving data" This message is likely the result of receiving data for a date that has already been downloaded, try again in a short while using Retry Update or downloading again later.
- "ichart.finance.yahoo.com" Please check your internet connection and try again using Retry Update or downloading again later.
- "No data retrieved" This message may be the result of no end of day data being available. Lookup the Yahoo symbol to see if this is the case, if there is data, try again in a short while using Retry Update or downloading again later.
- "No route to host: connect" Please check your internet connection and try again using Retry Update or downloading again later.
- "No start line" This message may result from being unable to connect to the internet, please check your internet connection and try again using Retry Update or downloading again later.
- "Read timed out" Try again using the Retry Update button.
- "Response not OK: HTTP/1.1 404 Not Found" This message may be the result of a busy server, try again in a short while using Retry Update or downloading again later.
- "Read timed out" Try again using the Retry Update button.
- "Software caused connection abort: recv failed" This message may result from being unable to connect to the internet, try again in a short while using Retry Update or downloading again later.
If the data is still not downloaded after a later retry then there may be no historical end of day data available. Lookup the Yahoo symbol to see if this is the case.